Lean Six Sigma: The Definitive Guide

This is a complete step-by-step guide to Lean Six Sigma in 2025.
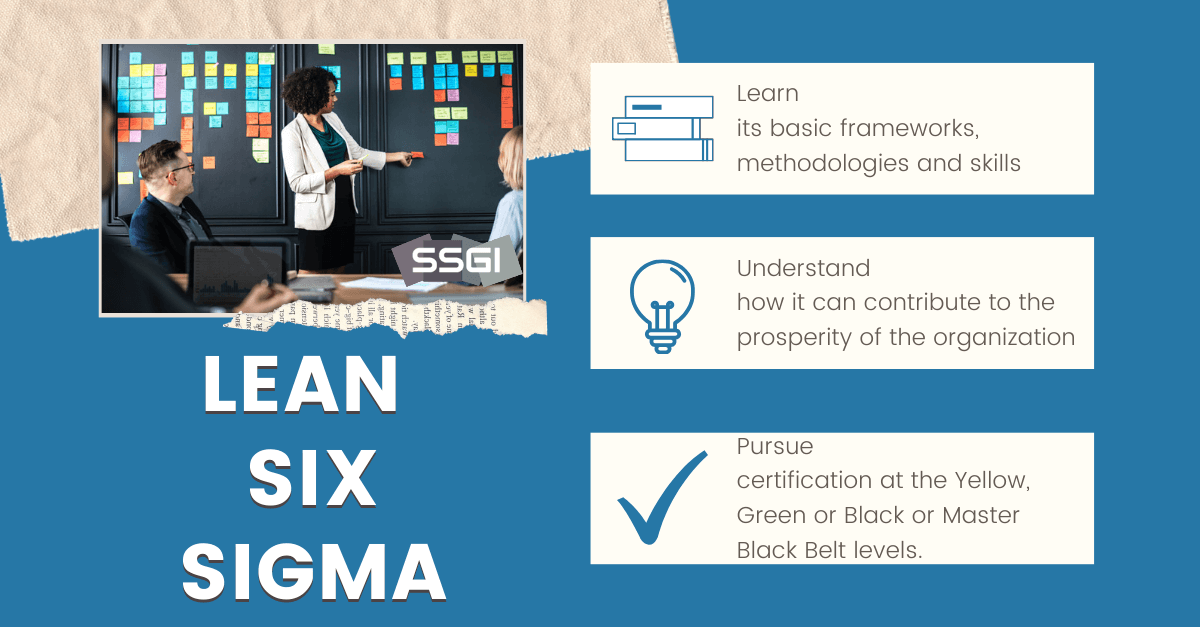
In this new Lean Six Sigma guide you’ll learn:
Let’s get started.
Chapter 1:
This process improvement guide has been written to be a practical, easy-to-understand and short approach to Lean Six Sigma, one that avoids jargon and statistics, but provides you with just enough insight to “drive the car.” It focuses on the basic frameworks, methodologies and skills.
It is written for two audiences. First, it is written for those who, as just described, really need a basic understanding of the body of knowledge. Second, it is written for those who would like a brief overview of the subject and who might also have an interest in expanding their skill set.
Lean Six Sigma is an approach to management that focuses on delivering customer value.
It is an approach – supported by a framework, methodologies and skills – that delivers this value by emphasizing efficient operational processes and quality outcomes.
As such, it is at the core of the organization’s strategy to meet the needs of its customers, clients, subscribers, end-users or patients.
“Because it is at the core of the firm’s strategy, those who understand and practice the concepts and skills of Lean Six Sigma become valuable organizational resources.”
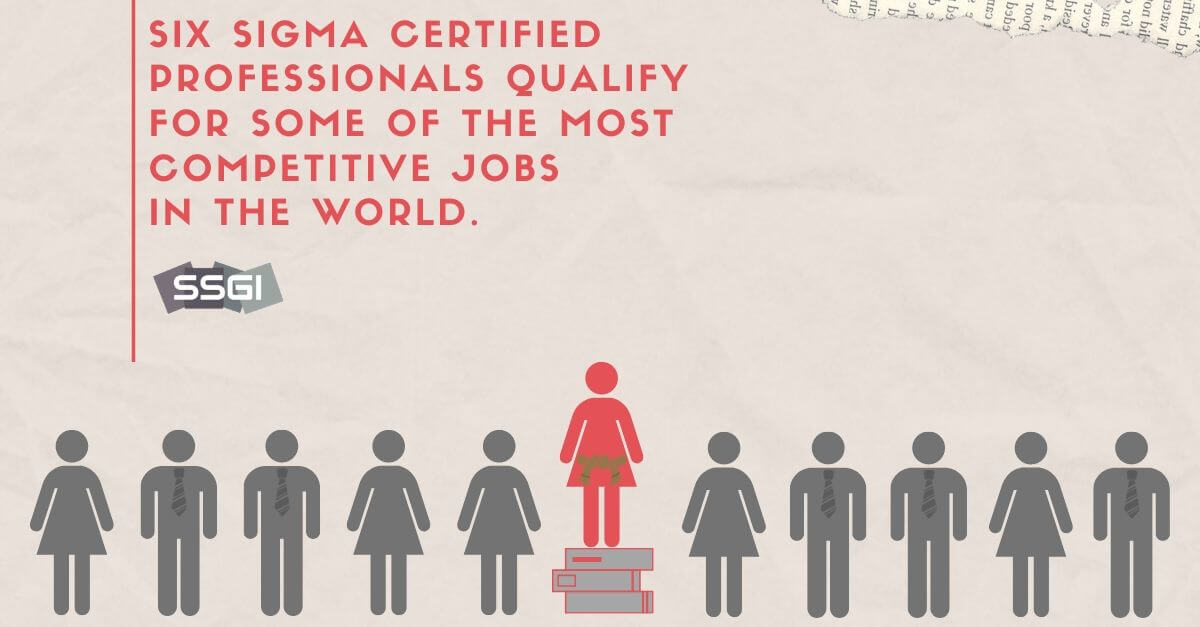
Lean Six Sigma is used across all industries and job functions.
Indeed, there is no other discipline at the operational level that is more important in directly addressing the organization’s ability to compete. Consequently, we can say that understanding Lean Six Sigma is an important step in becoming a productive member of any workforce.
And Lean Six Sigma is an approach that is appropriate across all industries from manufacturing, assembly, electronics, insurance, government services, online retailing, and entertainment, to healthcare. In short, the applications know no boundaries.
The problem, however, is that the field of Lean Six Sigma can quickly become bogged down in jargon and statistics. It can scare people away. However, and this is important, it is not necessary to develop an in-depth understanding of the field to understand when and how it is used.
Instead, you need to understand its basic frameworks, methodologies and skills. You need to know when it is appropriate to use them and when not to use them. Just as you don’t need to understand the mechanics of the internal combustion engine to drive a car, you don’t need to master the full body of knowledge associated with Lean Six Sigma to understand how Lean Six Sigma can contribute to the prosperity of the organization.
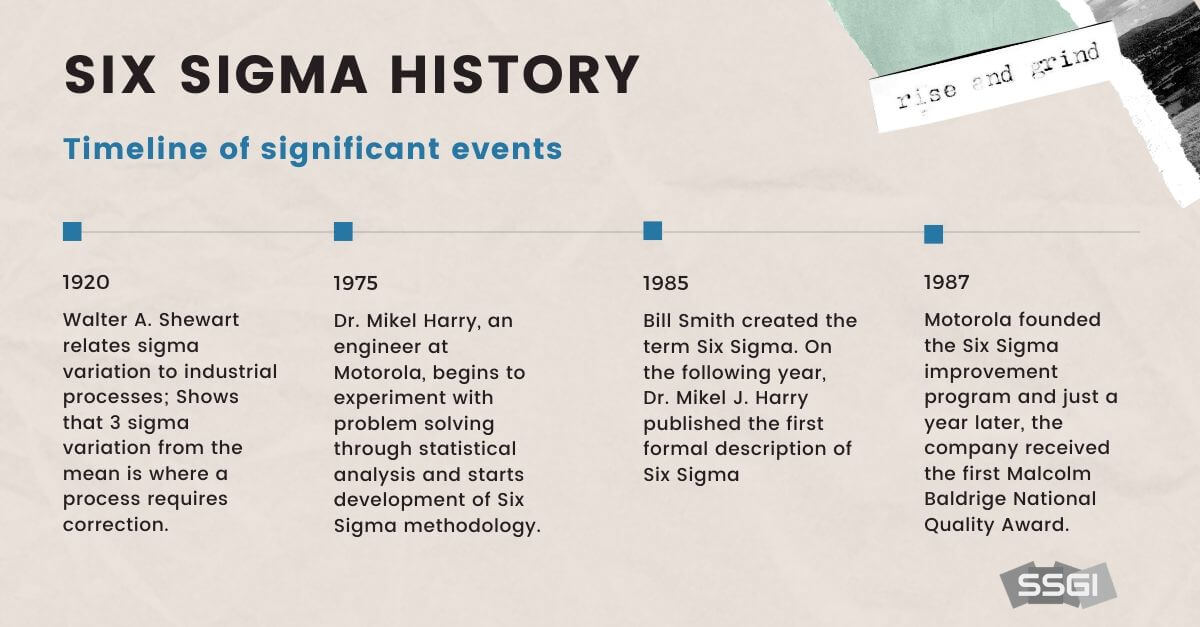
Several decades ago, at Motorola Corporation expressed concern that traditional methods of quality assurance were not enough to assure quality. Under his guidance, Motorola developed the methodology and cultural changes necessary to deploy a Six Sigma program that would change the way modern organizations deliver and manage quality control. The program was so successful that Motorola documented more than $16 Billion in savings from this new approach.
Since then, countless companies from manufacturing to health care have adopted Six Sigma. The most notable spokesperson for this discipline has been Jack Welch who implemented this program at General Electric in 1995.

Lean began in the automobile industry and dates back to the innovations in mass production introduced by Henry Ford. Utilizing interchangeable parts and moving conveyors, the concept of efficient process flow was born. The only shortcoming was Ford’s inability to deliver variety. You could order any color Ford as long as it was black!

There is a distinct difference between Lean and Six Sigma.
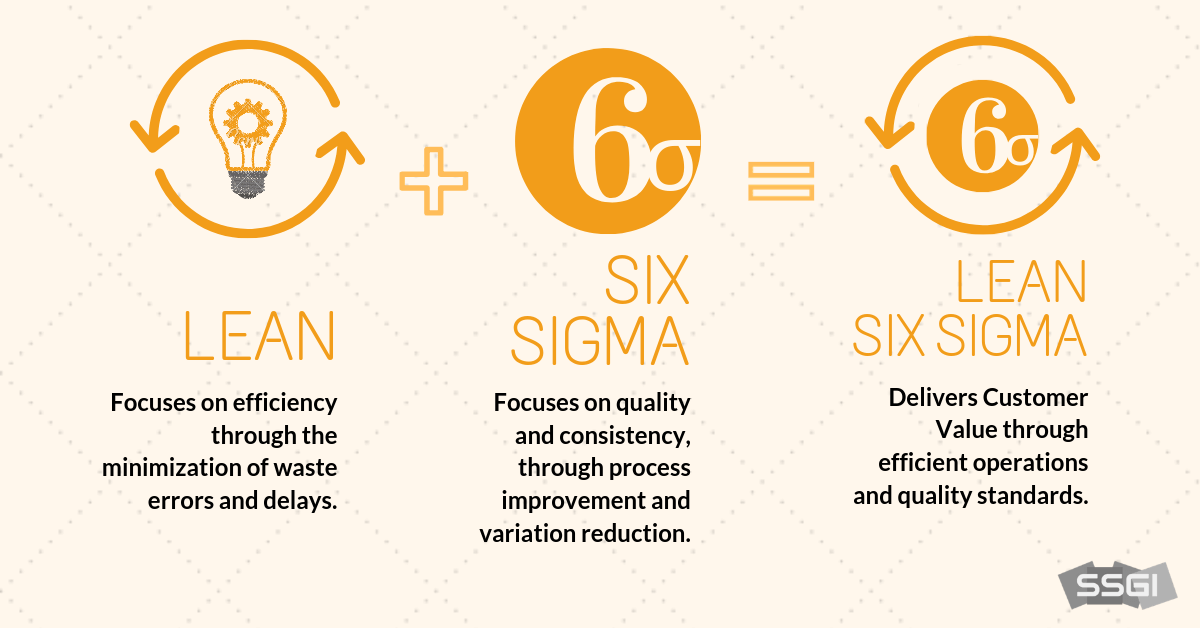
Lean addresses efficiency.
It is concerned with the design of operational process that minimize:
• Delays
• Errors
• Waste
Six Sigma, on the other hand, focuses delivering customer value by emphasizing:
• Quality
• Consistency
By consistency we mean the capability to deliver products and services that day-after-day meet quality standards; the product that is delivered today is just like the one that was delivered yesterday. When we eat a restaurant, purchase a new hard drive, or travel on an airplane, we expect a certain level of quality. The role of Six Sigma is to ensure that this level of quality is delivered to customers consistently.
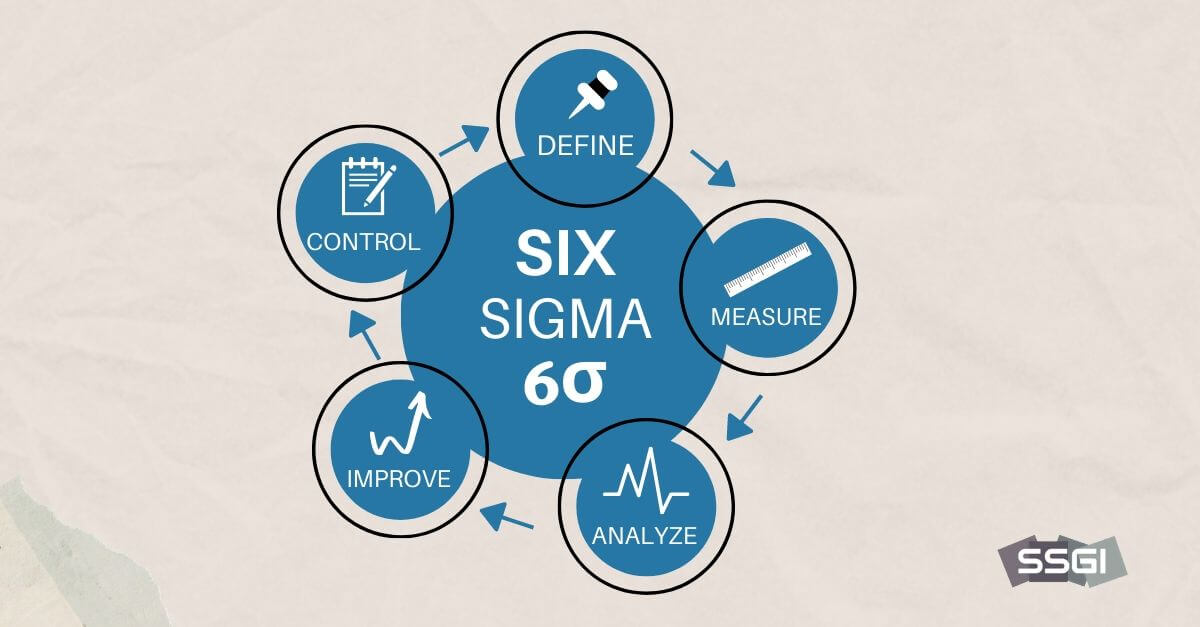
If you’re somewhat familiar with process improvement, you may have heard the term Lean Six Sigma DMAIC.
DMAIC is a framework followed by all Lean Six Sigma professionals from the beginning of a project to its end.
That framework is called DMAIC (Pronounced dee-may-uck), an acronym for Define, Measure, Analyze, Improve and Control. It is important because it guides us through an organized process for solving process challenges.
The first step, Define, focuses on identifying and summarizing the problem or opportunity that needs to be addressed. It should be written from a business perspective and identify the benefits and costs associated with undertaking the project.
In the second step, Measure, concrete and measurable milestones and goals are established. Vague goals such as “improve satisfaction” or “reduce delays” are avoided while concrete goals such as “improve satisfaction by 20 percent” or “reduce shipping delays by 2 hours” are used instead.
In the third step, Analyze, alternative solutions are identified and compared.
The fourth step, Improve, focuses on implementing the outcome of the Analyze stage. Here is where new equipment is purchased and installed, new procedures are put into action, and people trained.
Finally, the fifth step, control, addresses the need to establish control systems to ensure that the process maintains its standards over time. In most situations this involves the use of control charts covered later in this guide.
In this video Professor Barry Shore PhD explains DMAIC in detail for those looking to further understand the framework.
Now that you understand the basics of Lean Six Sigma, it’s time to start utilizing the tools.
There are many concepts and tools that guide Lean Six Sigma professionals as they design or improve processes. They include the following:
• Systems
• SIPOC Diagrams
• Voice of the Customer (VOC)
• Voice of the Process (VOP)
• Critical to Quality (CTQ)
• Value Stream Maps
• Cost of Poor Quality (COPQ)
• Process Mean and Variation
• Multi-Vari Charts
• Sampling
• Process Control
• Failure Mode and Effects Analysis (FMEA)
• Poka-Yoke
• Continuous Improvement
• Hypothesis Testing
• Regression Correlation Analysis
• Design of Experiments (DOE)
Organizations deliver products and services to customers and clients. Amazon delivers books, Yelp delivers restaurant reviews, YouTube delivers how-to videos, Cooper-Mini delivers autos, the Cleveland Clinic delivers heath care. Each and every one of them delivers products and services. They exist for no other reason.
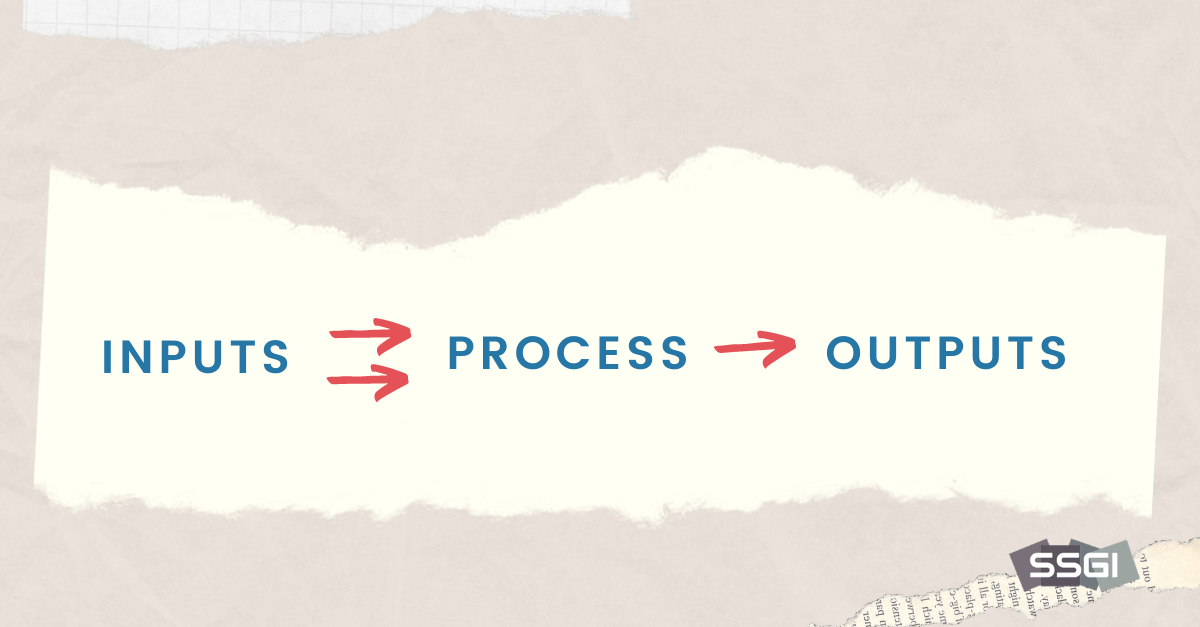
How are these products and services delivered? They are delivered through processes.
A process is defined as a system that transforms inputs into outputs.
To keep it very simple, consider that inputs to Amazon are products such as books and clothes. The process receives them from its suppliers and stores them at distribution centers. Orders are filled. The goods, which represent the output of the process, are then delivered to the customer.
At the beginning of a project, A SIPOC diagram is often used to identify the activities associated with a process. It identifies the Suppliers, Inputs, Process, Outputs and Customers, Hence the name SIPOC.
The reason this is so important is because an analysis of system activities is necessary before any steps can be taken to consider improvements, increase efficiency or improve quality. With a carefully constructed SIPOC diagram, assurances can be made that no activities have been left out.
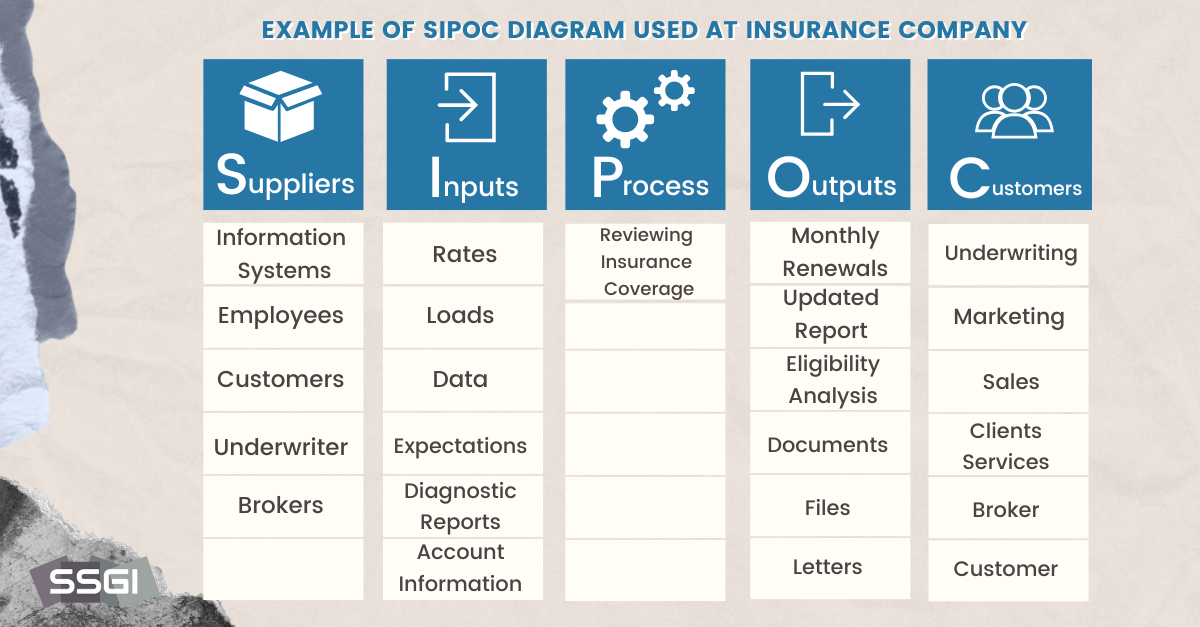
The SIPOC diagram shown above is an example of how this tool can be used to identify the activities in the claims processing department at an insurance company. This format, with its columns and rows, is commonly used.

Every process and every step within that process must be designed in such a way that it contributes to customer value. But what does the customer really want? To answer this question, we take the time to define the voice of the customer, called VOC.
It is defined through interviews, questionnaires, feedback from online product reviews, and comments found on social media. Facebook, Airbnb, Yelp and Amazon are all examples where the voice of customer can be heard.
What is very important is this: It is the Voice of Customer that drives the design or redesign of an operational process.
Processes also have a voice. They are all designed to deliver a specific product or service. As such they have their own characteristics and own capabilities.
Here is one example.
There are several companies on the internet that sell embossers like the one shown below.
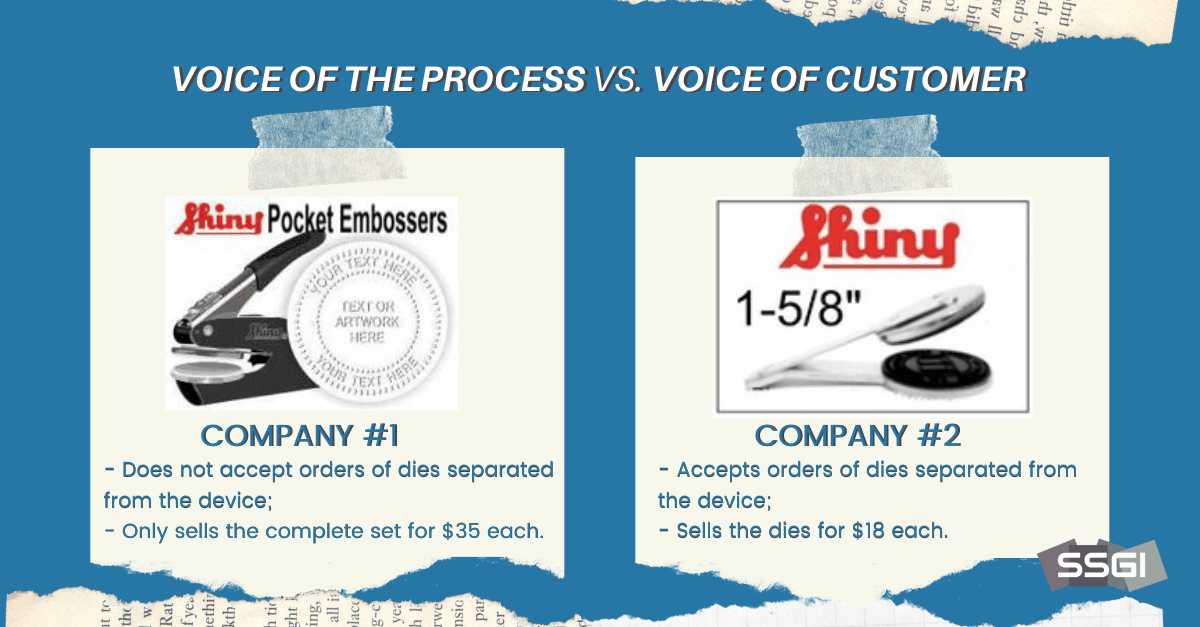
Notary Publics use them to emboss their seal on legal documents.
The customer sends the information they want on the seal to the company. A die is then made using Delrin, a durable plastic compound. This die can be inserted easily into the embosser. The embosser and the die are then sent to the customer. There is one company that will not separate the embossing device (shown on the graphic above) from the dies that are inserted into these devices. So, if a customer would like to order one embossing device and ten dies each one with different text, the company will not accept the order. That customer must order ten complete sets at $35 each. Another company, however, sells the dies separately for $18 each so this customer would need to order only one embossing device and ten separate dies.
As you can see, each company has its own voice. But the question is this, whose process best addresses the Voice of the Customer? Is there a mismatch between the Voice of the Process and Voice of the Customer?
Remember, to deliver customer value the Voice of the Customer needs to dominate!
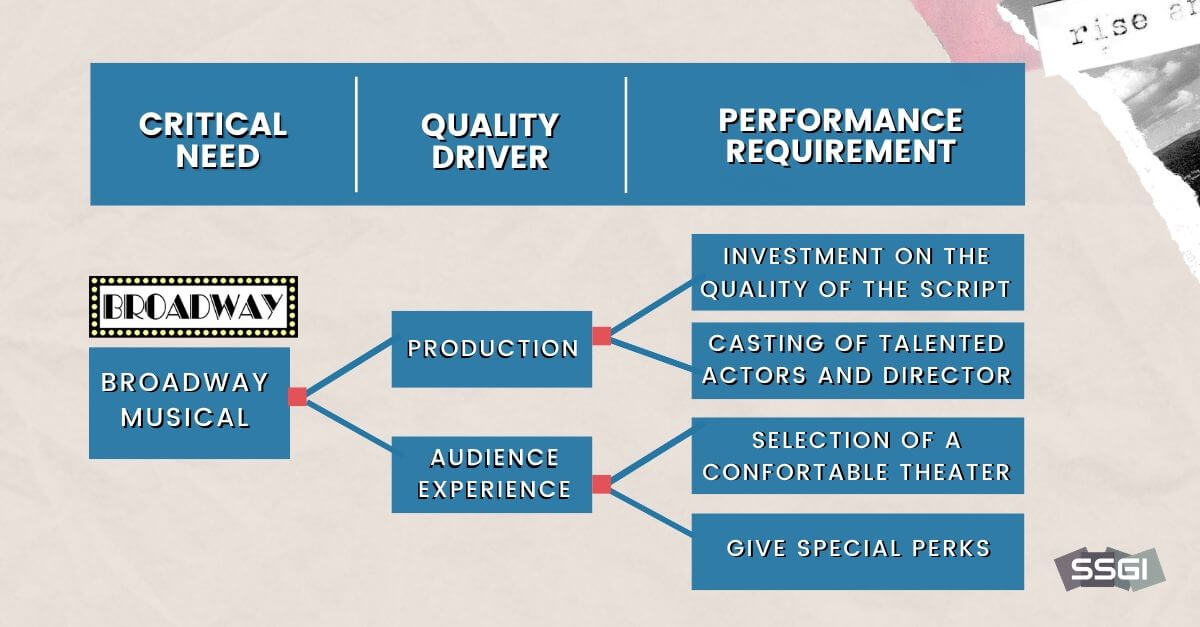
Critical to Quality, CTQ, represents those dimensions of a product or service that are instrumental in delivering a quality outcome to the customer, client, patient or end user.
When directing a musical on Broadway, the CTQ would include the quality of the script, actors and music.
When managing a cruise boat experience the CTQ would include the quality of the food, entertainment, onshore excursions, onboard shopping, and staff. When designing a cell phone, CTQ would include the quality of the operating system, battery life, image quality, positioning of buttons, and camera quality.
In designing an air bag for an automobile, CTQ would include the ability of the bag to: inflate properly upon impact, inflate to a specified pressure, not inflict damage to the occupants of the vehicle, and maintain these characteristics over the expected life of the automobile.
A Value Stream Map is a visual display of the sequence of steps followed in a process. Each step is identified including delays. Once completed, the map can then be used to determine where improvement can be made as well as where delays can be eliminated.
Since it is visual, it can be shared with a wide variety of stakeholders including management.
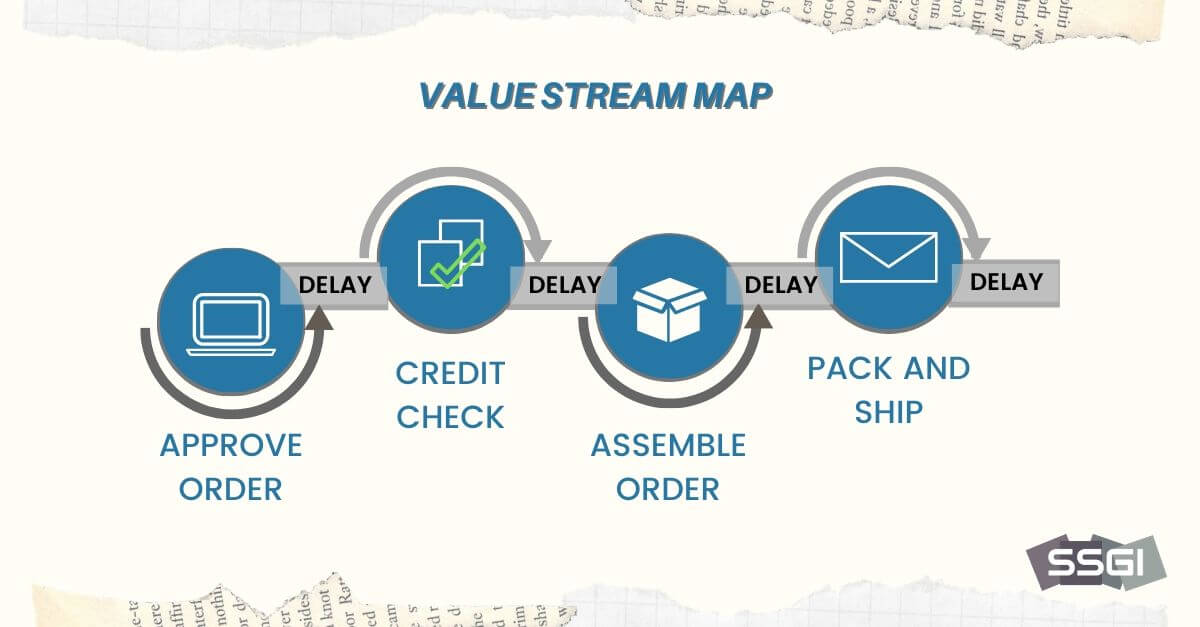
A simple order processing operation is shown above. Orders are approved, credit is checked, the order is assembled and finally the order is packed and shipped. While this is an oversimplified Value Stream Map it is enough to show that we represent steps by rectangles and represent delays by a shape resembling the letter “D”. Four sources of delay are identified in this map and will undoubtedly be the subject of careful analysis to either minimize or eliminate them.
Lean Six Sigma promises efficient and consistent output at appropriate levels of quality.
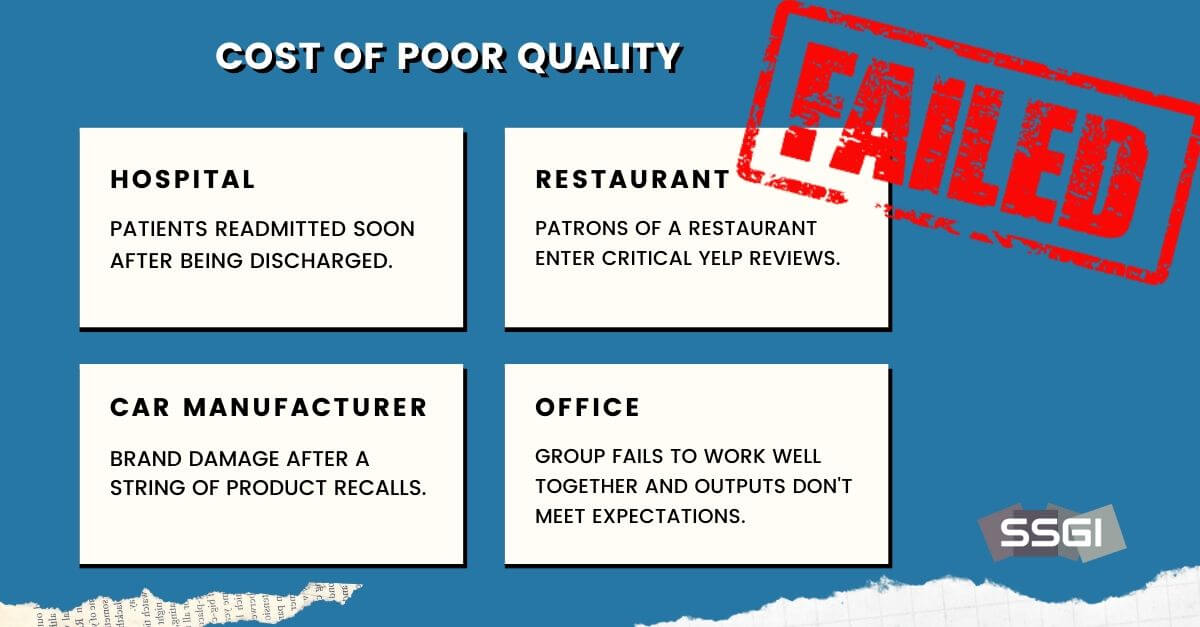
Clearly, poor quality is to be avoided, but it does happen. The term Cost of Poor Quality, COPQ, represents the costs that would disappear if the process that delivers products and services had been perfect.
The Cost of Poor Quality is incurred when customers return a recently purchased item because it failed to perform as expected. The Cost of Poor Quality is incurred when patients are readmitted to a hospital shortly after they have been discharged. The Cost of Poor Quality is incurred when a company’s brand is damaged after a string of product recalls. The Cost of Poor quality occurs when patrons of a restaurant enter critical Yelp reviews. And the Cost of Poor Quality occurs when a and the output from the group fails to meet expectations.
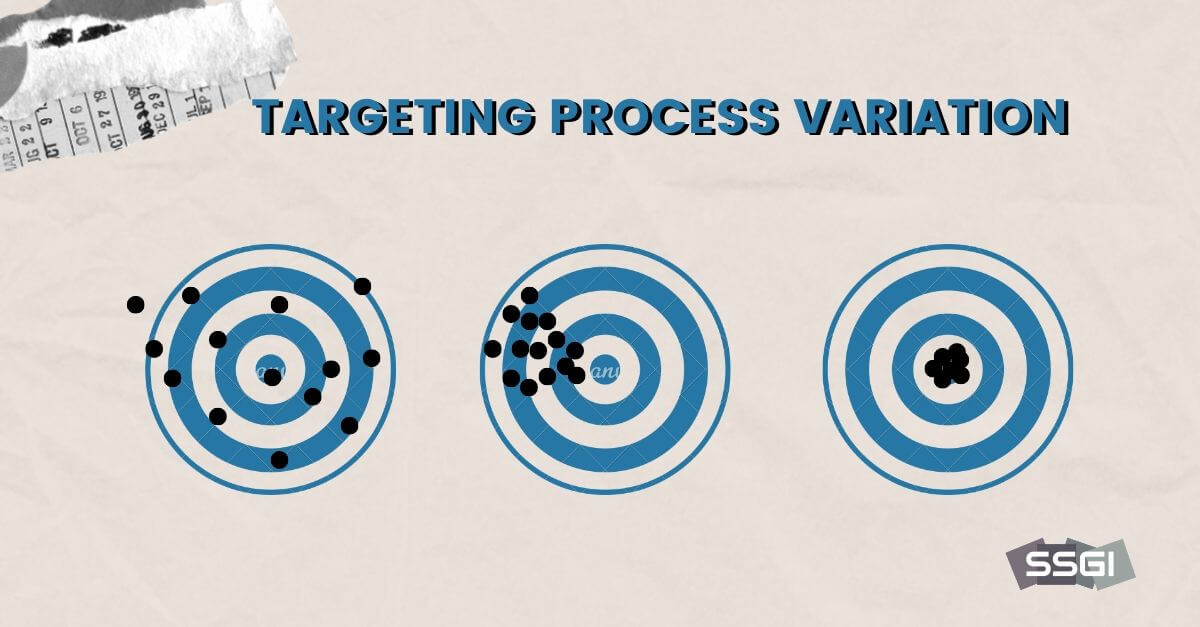
Process output can be summarized with two statistics: mean and variation. The mean is the average output over time. For example, the average length of time it takes to process an order or the average level of customer satisfaction. The average then represents the “central tendency” of a dataset. Rather than reviewing each one of 200 customer satisfaction questionnaires, the data is summarized in one number, the average or mean. Now, only one number needs to be reviewed.
But the mean does not tell the whole story. Data items do vary around the mean. As a result, we also need a statistical measure that captures the extent of variation in the dataset. A simple statistic to measure variation is the range. It is computed by subtracting the smallest number in a dataset from the largest number.
For example, if the longest a person waits to reach a specialist at a call center is 12 minutes and the shortest time is 2 minutes, the range is 12-2 or 10 minutes.
Here is a very important point. There is no operational process where the output is exactly the same from one unit of output to the next. No meal turned out at a resultant is exactly the same as the next. There is some variation. So, we use the concepts of mean and variation to more fully describe process output.
A Multi-Vari Chart is used to compare the mean and variation of one or more processes. It is simple and avoids the use of more sophisticated statistics. Nonetheless, it provides significant insight into the mean and variation of these processes.
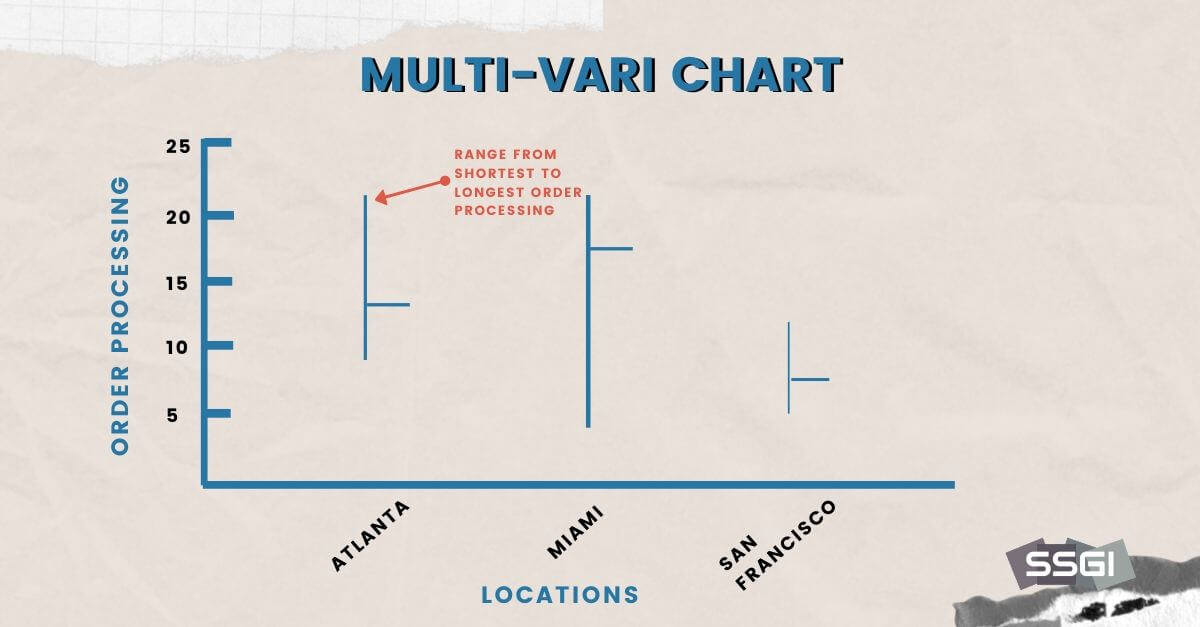
The Multi-Vari Chart shown above illustrates how this tool can be used. The vertical lines represent the highest and lowest order processing times for three distribution centers. The short horizontal bar represents the process mean. The three processes summarized on this chart suggest that the San Francisco distribution center not only has the shortest range of processing times, but its average processing time is lower than the other two distribution centers. It appears that the processes at Atlanta and Miami need to be the subject of a Lean Six Sigma study.
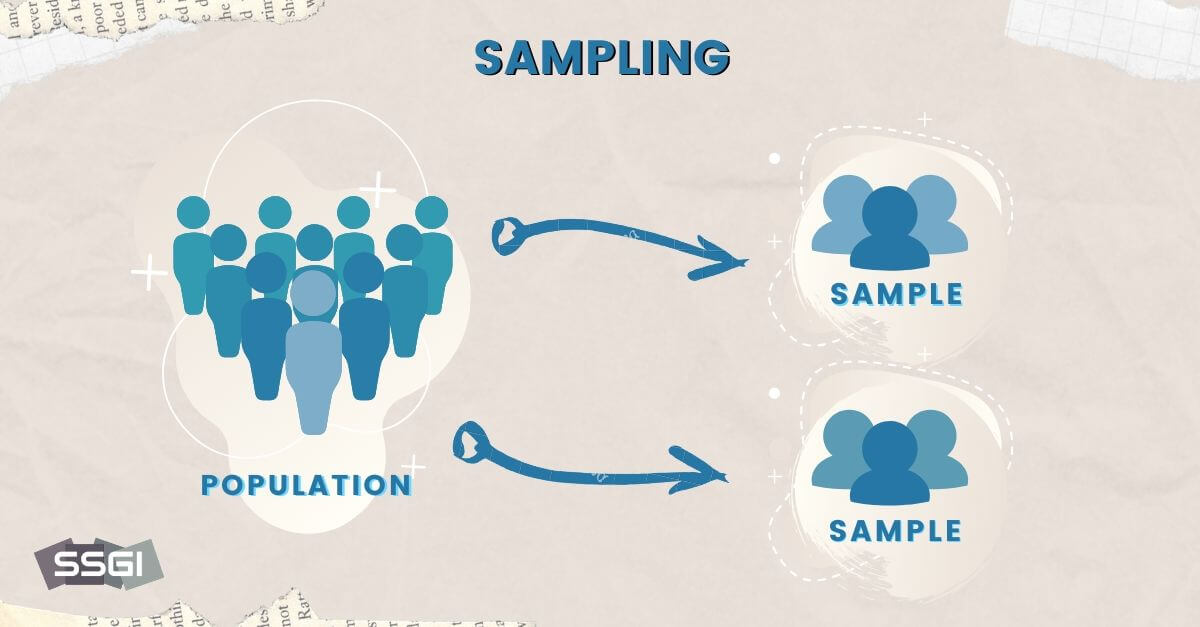
A population includes every item or unit of interest. It might be all citizens who plan to vote at the next election, all autos assembled today, all customers who purchase items last month, or all employees who work for a company. When we need to make a statement about the population it is often too time consuming or costly to review every single item in that population. In these circumstances a sample is taken, and the mean calculated. This mean is then used to make a statement about the population.
The most common example is political polling, where a sample of 2,000 or fewer potential voters is taken and, from this sample, an estimate is made about the voting preferences of more than a million people (the population of registered voters). Yes, there is some uncertainly in this estimate, but it is remarkable how close sample results can be to the true but unknown population value.
Let’s explore the characteristics of samples in somewhat more detail.
When two separate samples are taken, it would be rare for these sample means to be exactly the same. Suppose a sample of 30 employees is taken from a large population. They are asked to rate job satisfaction on a scale of 1 to 7. Shortly after this another sample of 30 is taken. Would you expect these sample means to be the same? No, they may be close, but it is highly unlikely they will be the same.
So, we can conclude that sample means from the same population vary. This is an essential concept in process control.
When monitoring and controlling processes, a single sample is taken. The mean of the sample is calculated and plotted on a chart that we will call a quality control chart. This chart includes a centerline which is called the target and represents the expected average or mean results of the process.
Consider a stable process, one in which the mean has not shifted for some time. Since sample means vary, we would expect that when we plot sample results on a Control Chart, one sample mean taken today from the stable process will be different from another taken tomorrow. Remember, sample means vary! The difference between the means may not be large, nonetheless, there will be a difference.
Below is an example of a control chart.
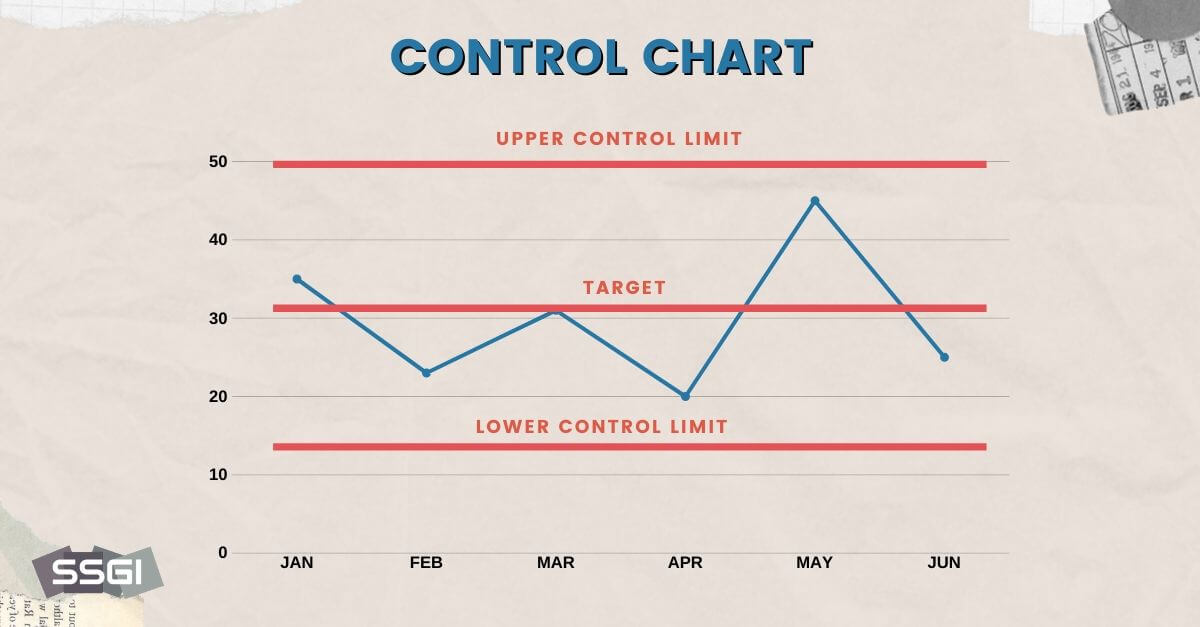
The sample data points are connected by a straight line to facilitate reading the chart. As long as these sample means are reasonably close to the target line and vary randomly around it, we say that the process is in control. But there is more. An upper and lower control limit is also drawn on the chart. Now we have some help in determining whether the process is in-control. As long as the sample means fall within the Upper and Lower Control limits, we say that the process is in control.
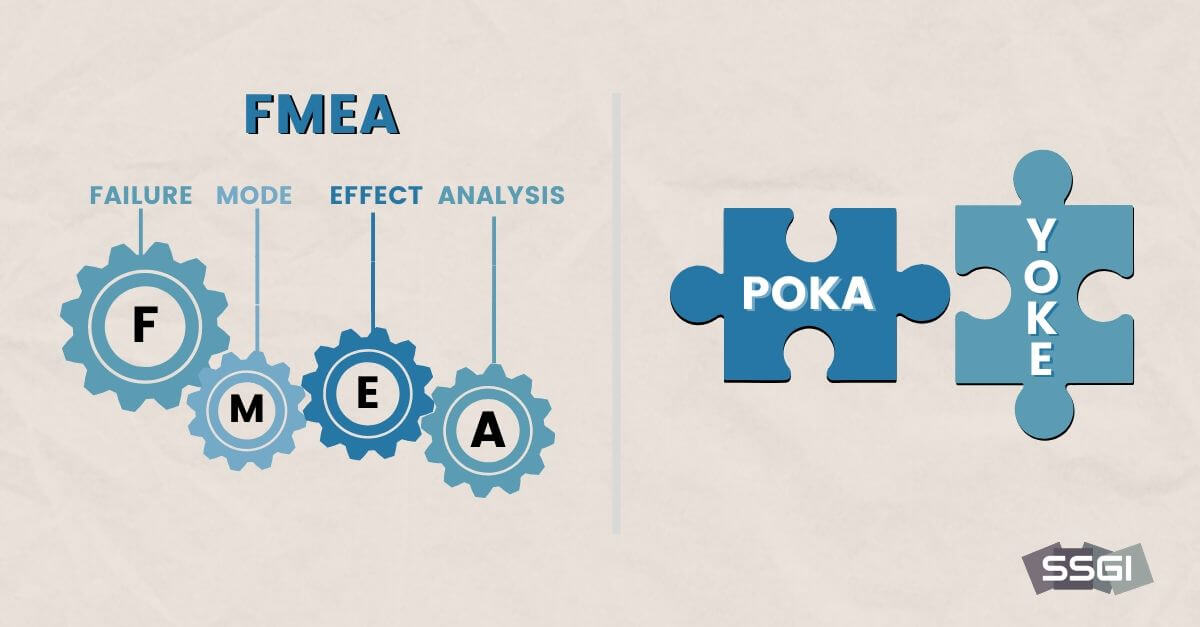
FMEA is an abbreviation for Failure Mode and Effects Analysis. Rather than waiting for problems to occur and then reacting to them, doesn’t it make more sense to be proactive and anticipate the vulnerable points in the process. This is precisely the focus of FMEA. Stakeholders convene a brainstorming session to uncover what could possibly go wrong. On the basis of these discussions, steps are then taken to eliminate the potential trouble spots.
Poka-Yoke, pronounced poka-yo-kay, is a Japanese term for ‘mistake proofing’.
It introduces safeguards to make it difficult or impossible to commit an error.
For example, the top drawer on clothes washing machines cannot be opened during the washing cycle. This prevents water or soap from spilling over the top and flooding the floor.
Or, the shape of a plug is configured in such a way as to assure that it can only be inserted in one direction.
Another example is the use of magic markers by surgeons to mark a surgical site and thereby prevent a wrong-side surgery.
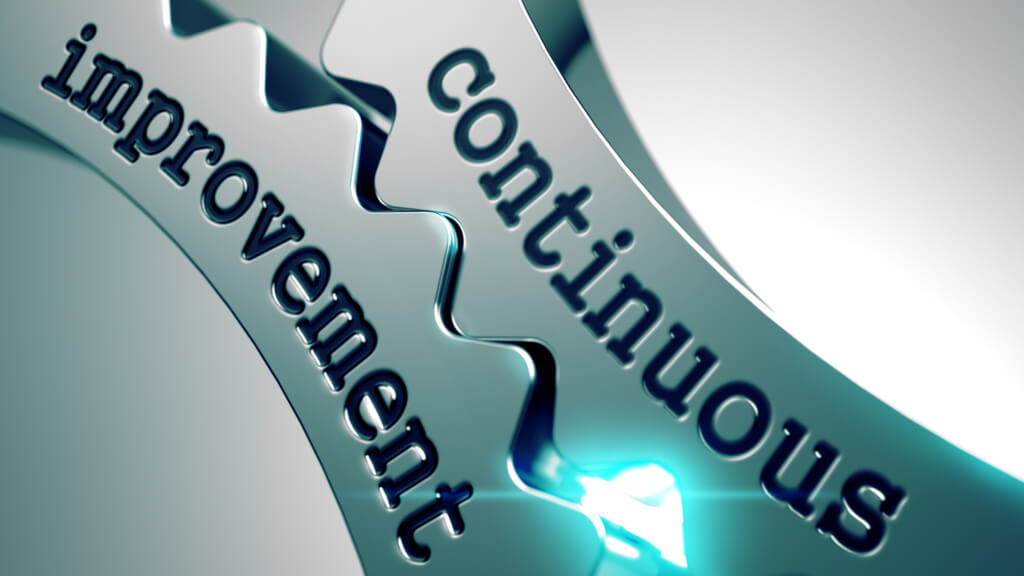
Process output seldom, if ever, achieves near-perfection. Even if it does, there are changes that occur in process technology, process strategies, competitive innovation and consumer tastes. As a result, an important principle of Lean Six Sigma is to be constantly on the lookout for ways to improve performance. While a major disruptive change may be appropriate at infrequent intervals, continuous improvement generally involves small incremental changes undertaken one-at-a time.

Hypothesis testing is a statistical tool used to determine if the results of one sample are really different from the results of another sample. For example, if we determine that customer satisfaction this month, using a scale of 1 to 100, is 78, can it be concluded that satisfaction is significantly different from a score of 76 the previous month? Remember, sample means vary so this difference may be due to chance alone, and satisfaction may not have changed at all.
In hypothesis testing, we begin by creating a hypothesis. One such hypothesis may be that customer satisfaction has not changed over the last month. We then compare the results of our two samples by using what is called a test of hypothesis. It determines if these results are significantly different from one another. In other words, the differences are not due to chance variation. The test results therefore help us to accept or reject the hypothesis.
In a simple regression analysis, we start with a dependent variable and a single independent variable, collect data for each of them and then undertake an analysis to determine if the independent variable can explain changes in the dependent variable.
For example, the dependent variable may be sales and the independent variable may be advertising expenditures. Suppose the marketing department would like to know if changes in advertising expenditures (the single independent variable) affect changes in sales (the dependent variable). If they found that advertising does affect sales, they would also like to know the magnitude of this affect. They can use this information to make more informed marketing decision and avoid wasting resources.
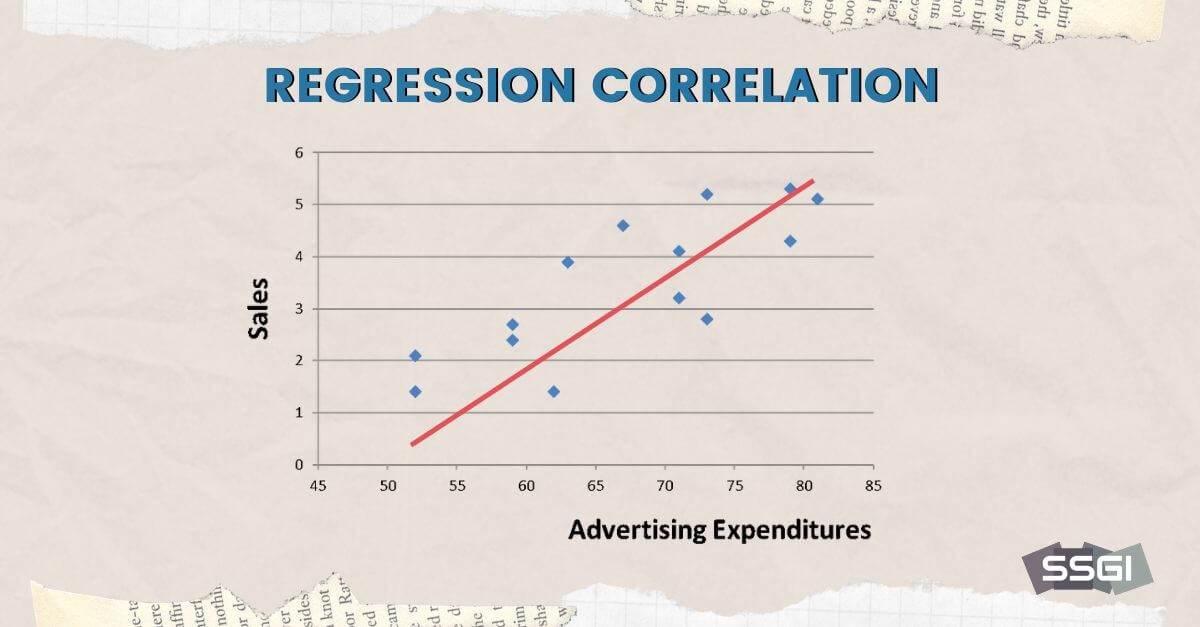
The data plot shown above does suggest that there is a relationship; when advertising expenditures increase, sales increase.
A better description of this relationship can be obtained by drawing a regression line. This is a line that represents a “best fit” to these points. Correlation, another outcome of the analysis, measures the degree of fit between the points and the regression line. The closer are the points to a line, the higher is the degree of correlation.
High correlation means that we can have confidence in our belief that advertising is related to sales.
To improve our competitive position, to improve customer satisfaction, to improve efficiency, or to improve quality, organizations need to experiment. They need to determine which combination of inputs best meets their product or service goals. This is not an easy undertaking because there are usually many input combinations that could affect results.
Think about baking a cake. You may have many possible ingredients that could be used and in addition you could use different levels of each ingredient. Experimenting to identify the ingredients and levels to bake the best cake is not a trivial undertaking.
Here is the problem. While it makes sense to experiment, not many organizations do it. Instead, they settle on one way and hope that their goals are achieved. Worse, they may be unaware that simple changes may have a significant effect on outcomes. As a result, these organizations may never know where to improve or how to improve.
When experimentation is appropriate, the statistical approach called Design of Experiments or DOE should be used. It helps to determine the most efficient way to evaluate these combinations such that the experiment can be kept to a reasonable scale and then helps to analyze the results in the process of finding the combination of inputs that will lead to the best results.
Six Sigma Certifications (Belts) include the following:
View an introductory video below, where we explain the difference between each Lean Six Sigma belt.
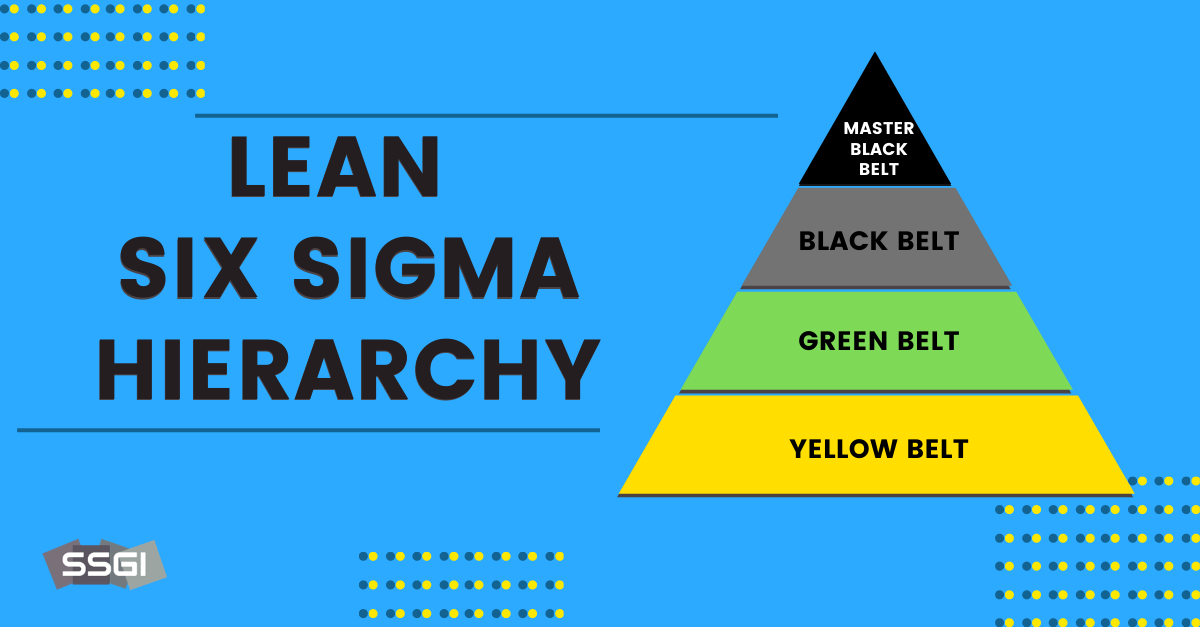
Skill sets in Lean Six Sigma are divided into four recognizable levels (belts), each one associated with professional certification. These levels range from Yellow to Master Black Belt.
Those who earn a Yellow Belt can work with Six Sigma teams and assist in data collection, analysis and implementation of results. It is the first step in the path to even higher levels of Six Sigma certification.
The Green Belt is more advanced and begins to cover the full range of topics that represent the Six Sigma body of knowledge. Those who have earned this level of certification work under the supervision of a Black Belt.
A Black Belt has developed proficiency in the complete body of knowledge associated with Six Sigma and can lead small projects.
A Master Black Belt has not only developed proficiency in the body of knowledge but is also capable of managing large-scale projects while supervising those who hold Yellow through Black Belt certification.
Professor Barry Shore PhD and SSGI Founder goes into detail on the various levels of Six Sigma certification belt levels. Listen to the videos below to learn more about the topical coverage and focus of each Lean Six Sigma Belt.


If you have found the material in this guide interesting and useful, you might consider becoming professionally certified in Lean Six Sigma.
If so, you probably have two questions in mind.
How difficult would it be and how long would it take?
The answers depend upon several factors.
First it depends upon where you begin. For some people the Yellow belt is a perfect starting point because it focuses primarily on frameworks and concepts and not statistics.
On average, a person should be able to cover the Yellow Belt body of knowledge in less than two weeks. But, above all, the course will be no more difficult than this guide.
The Green Belt is definitely more challenging, but if you choose an intuitive and clearly written presentation with practical examples, the belt should be accessible to anyone reading this guide. It is challenging because it goes into more depth than does the Yellow Belt. As a result, it will take between four to six weeks before you are ready to take the certification exam.
Black Belts take longer, in the range of 1-5 months depending on the background you bring to the course.
To learn more about how long it will take to get certified, view the program of your choice below.

There are several criteria that should be considered when you choose a course.
• Read as many testimonials as you can. What do those who have taken the course have to say?
• How clear is the presentation? It must be logical and understandable. Heavy reliance on statistics is not necessary. The purpose of these courses is not to train statisticians!
• How long do you have access to the material? Some organizations limit access.
• Does the course fee cover all the materials including the certification exam? Many charge extra.
• Is the certification globally recognized and industry trusted? What does LinkedIn have to say?
• What supplementary materials are included? Do they include study guides, practice exams, videos and flash cards?
If you are interested in learning more about a specific Lean Six Sigma program please click through to the course of your choice below.
We hope you found this new Lean Six Sigma guide helpful.
Now we’d like to hear what you have to say:
Which lean six sigma tool do you want to learn more about?
What do you find most important about process improvement?
Let us know by commenting and sharing this guide.
![]()
If you enjoyed this guide, please share!